What happened in the Naples luxury real estate market in January 2026?
Welcome to the February 2026 edition of Matt Brown's Naples Luxury Real Estate Newsletter. This month's data tells a clear story: the Naples luxury market opened 2026 with decisive momentum. Pending sales surged 40.3% year-over-year, luxury single-family prices continued their upward trajectory, and Port Royal posted $696.3M in closed dollar volume — up 106.8% year-over-year. Cash buyers remain dominant, and inventory across the Naples Beach luxury tier has contracted sharply heading into the spring selling season.
Overall Naples Market · January 2026 · Selected Indicators
RealTrends Verified: #922 Nationally · #13 in Naples (2024) · Top 1.5% of Agents Nationwide (2025)
This month I’m taking a closer look at the Port Royal Club rebuild and what it means for property values, membership demand, and the long-term prestige of Naples’ most exclusive waterfront enclave, full analysis in my Port Royal Club article. Our updated Port Royal Real Estate community page covers current listings, waterfront lot opportunities, and the market dynamics behind this month’s charts. The full data and analysis are below, if you are evaluating a buy or sell decision, I am available for a direct conversation.
Best Regards,
Matt
Get Matt Brown's Naples Luxury Market Report every month.
The data, analysis, and local intelligence that $700M+ in career sales is built on — delivered directly to you.
No spam. Unsubscribe any time.
What did the Naples luxury market data show in January 2026?
The Naples luxury market entered 2026 in a stronger position than most buyers and sellers anticipated. Across the $1.5M–$5M tier, closed sales rose and single-family median prices held firm at $2,350,000 — stability, not softness. At $5M and above, both transaction volume and median prices climbed, with single-family median reaching $8,162,500, up 8.8% year-over-year. The Port Royal to Bonita Beach Road corridor tells the clearest story: single-family closed sales surged 35% while available inventory fell 22%, creating meaningful supply pressure for buyers who have been waiting. The luxury condo market in the same corridor is softer — closed sales declined 20% — giving buyers in that category real negotiating leverage today.
| Metric | 12 Mo. Ending Jan 2026 | 12 Mo. Ending Jan 2025 | % Change |
|---|---|---|---|
| Closed Sales (All Properties) | 1,062 | 1,032 | +2.9% |
| Median Closed Price — Single-Family | $2,350,000 | $2,300,000 | +2.2% |
| Median Closed Price — Condo | $2,200,000 | $2,331,500 | −5.6% |
| % of List Price Received | 92.6% | 94.3% | −1.8% |
| Metric | 12 Mo. Ending Jan 2026 | 12 Mo. Ending Jan 2025 | % Change |
|---|---|---|---|
| Closed Sales (All Properties) | 246 | 222 | +10.8% |
| Median Closed Price — Single-Family | $8,162,500 | $7,500,000 | +8.8% |
| Median Closed Price — Condo | $6,525,000 | $6,185,000 | +5.5% |
| % of List Price Received | 91.8% | 93.2% | −1.5% |
Source: NABOR® January 2026 Market Report, Southwest Florida MLS. Data current as of February 10, 2026.
| Metric | Jan 2026 | Jan 2025 | % Change |
|---|---|---|---|
| Median Closed Price — Single-Family | $2,645,000 | $2,500,000 | +5.8% |
| Average Closed Price — Single-Family | $5,107,578 | $4,927,835 | +3.6% |
| Total Sales | 50 | 51 | −2.0% |
| Inventory | 583 | 742 | −21.4% |
| Months Supply | 12.8 | 20.2 | −36.6% |
Source: NABOR® January 2026 Market Report, page 17. Naples Beach area covers zip codes 34102, 34103, and 34108. Browse homes by Naples zip code →
| Metric | Value | YoY Change |
|---|---|---|
| Closed Sales | 412 | +35% (vs 306) |
| New Listings | 790 | −12% (vs 897) |
| Available Inventory | 483 units | −22% (vs 619) |
| Months of Supply | 14 months | — |
| Average Sales Price (YoY) | $5,881,917 | +3% |
| Median Sales Price (Jan 2026) | $4,925,000 | +82% vs Jan 2025 |
| Metric | Value | YoY Change |
|---|---|---|
| Closed Sales | 481 | −20% (vs 602) |
| New Listings | 1,077 | −13% (vs 1,235) |
| Available Inventory | 673 units | −4% (vs 699) |
| Months of Supply | 17 months | — |
| Average Sales Price (YoY) | $2,502,702 | −11% |
| Median Sales Price (Jan 2026) | $1,600,000 | −29% vs Jan 2025 |
Source: William Raveis Luxury Market Report — January 2026, Naples, FL. Southwest Florida MLS © 2026.
| Community | Inventory | Inv % | Closed Sales | Sales % | Mo. Supply | Avg Sales Price | Price % |
|---|---|---|---|---|---|---|---|
| Grey Oaks | 18 | −14% | 35 | −24% | 6.2 | $4,712,257 | +7% |
| Mediterra | 22 | −21% | 29 | +4% | 9.1 | $3,794,775 | −12% |
| Olde Naples | 77 | +15% | 61 | +53% | 15.1 | $6,302,869 | −17% |
| Park Shore/Moorings — Waterfront | 31 | +15% | 28 | +56% | 13.3 | $8,056,250 | +3% |
| Park Shore/Moorings — Non-Waterfront | 111 | +10% | 110 | +36% | 12.1 | $5,198,617 | +1% |
| Pelican Bay | 45 | +5% | 75 | +63% | 7.2 | $3,752,237 | −3% |
| Pine Ridge | 33 | +10% | 25 | +14% | 15.8 | $7,227,572 | +18% |
| Port Royal | 29 | −26% | 29 | +71% | 12.0 | $24,011,897 | +21% |
| Quail West | 23 | +10% | 39 | +8% | 7.1 | $4,357,017 | −5% |
| Royal Harbor | 32 | +23% | 18 | +13% | 21.3 | $4,141,097 | −30% |
Source: William Raveis Luxury Market Report — Community Snapshot, January 2026. Single-family residential. Southwest Florida MLS © 2026.
Explore active listings, pending sales, closed prices, and inventory trends across all Naples communities — updated monthly by NABOR®.
Source: NABOR® InfoSparks. Data reflects Southwest Florida MLS activity in Collier County, excluding Marco Island.
What does the January 2026 Naples luxury market data tell us?
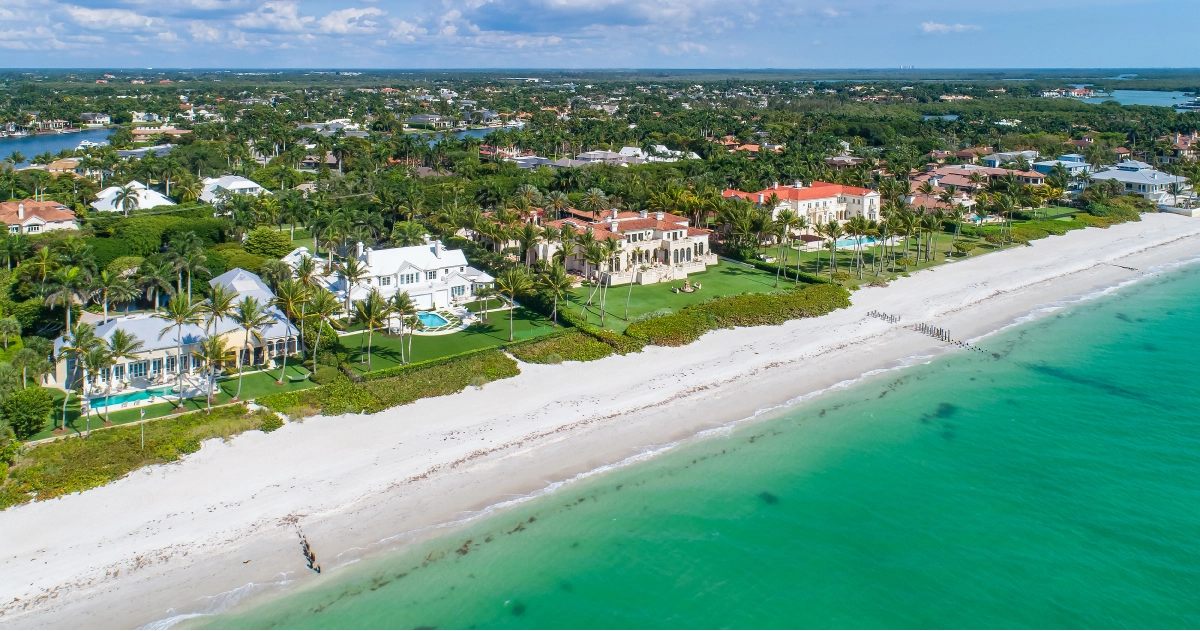
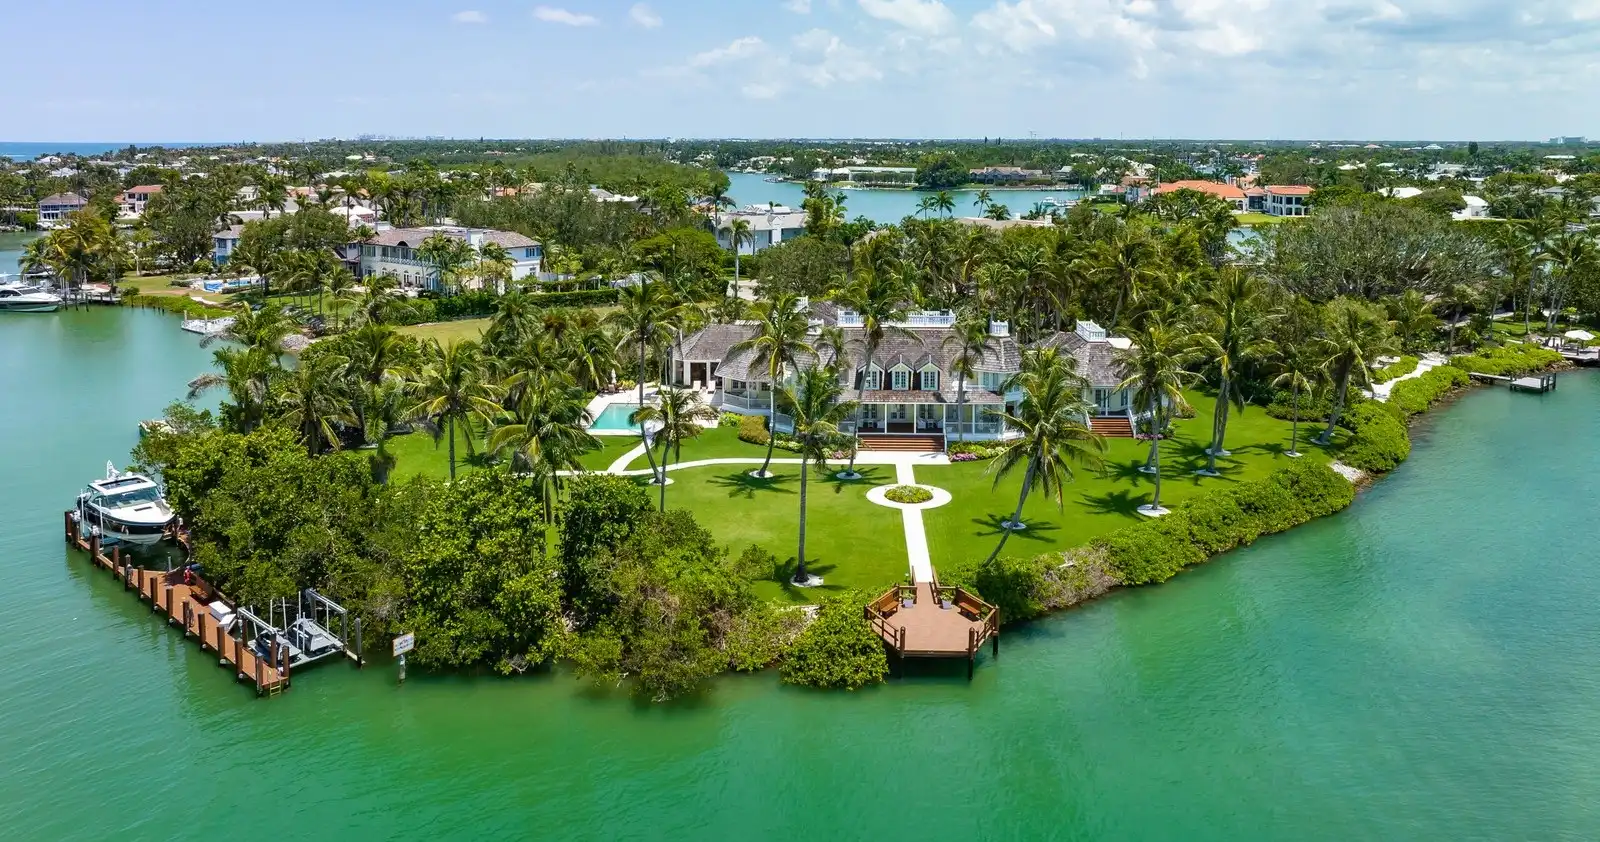
Port Royal, Naples, Florida — the most exclusive waterfront neighborhood in Southwest Florida.
What is happening in Port Royal real estate right now?
Port Royal is experiencing a defining shift. The ten charts below cover every key market indicator for Port Royal single-family homes from 2021 through January 2026 — a market that corrected significantly from its 2021–2022 peak, found its floor in 2023–2024, and has now re-accelerated with unusual force.
| Metric | Methodology | Jan 2026 | YoY Change | 5-Year Trend |
|---|---|---|---|---|
| Total Dollar Volume of Closed Sales | 12-mo rolling avg | $696,345,000 | +106.8% | Peaked 2021–22, bottomed 2024, now surging |
| Average Sales Price | 12-mo rolling avg | $24,011,897 | +21.3% | Steady rise from $10M in 2021 |
| Average Price Per Sq Ft | 12-mo rolling avg | $3,719 | +41.4% | Re-accelerating after 2024 dip |
| Total Sales | 12-mo rolling total | 29 | +70.6% | Recovering from 2024 lows of 10–12 |
| Pending Sales | 12-mo rolling total | 28 | +47.4% | Climbing from 2023–24 floor |
| Homes for Sale | Active inventory | 29 | −31.0% | Down from peak of ~44 in mid-2024 |
| Months Supply | Rolling sales pace | 10.0 | −59.5% | Down from 25.7 peak; tightening |
| New Listings | 12-mo rolling total | 39 | −9.3% | Declining from 2021 peak of ~68 |
| Average Days on Market | 12-mo rolling avg | 231 | +13.2% | Reflects $15M–$50M+ timelines |
| Avg % of Last Sales Price | 12-mo rolling avg | 88.5% | +0.7% | Stabilized 88–89% since 2024 |
Source: NABOR® / Southwest Florida MLS. Port Royal single-family residential. January 2021–January 2026. Data current as of February 10, 2026.
Each of the ten charts below represents five years of Port Royal single-family market data, calculated as labeled. Read alongside the table above for the complete picture.
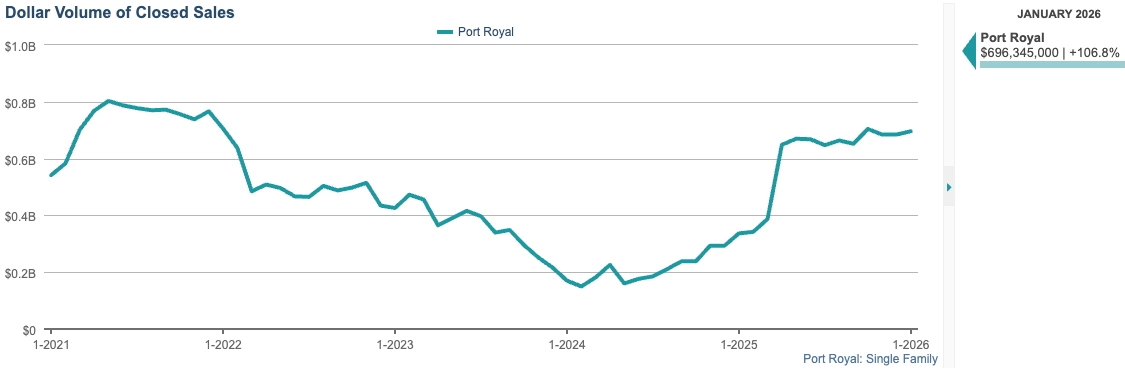
Dollar volume more than doubled year-over-year, driven by both higher prices and more transactions. Volume is back to levels last seen at the 2021–22 peak.
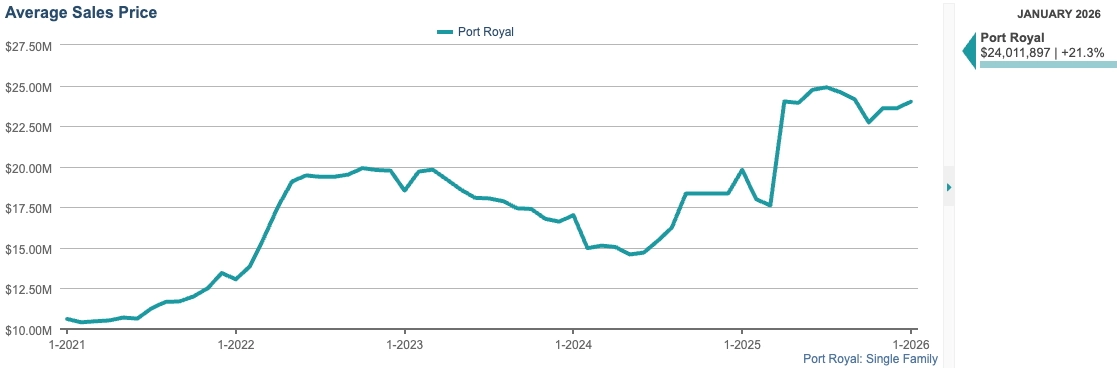
Average price climbed steadily from roughly $10M in 2021 to $24M today, with acceleration beginning mid-2025.
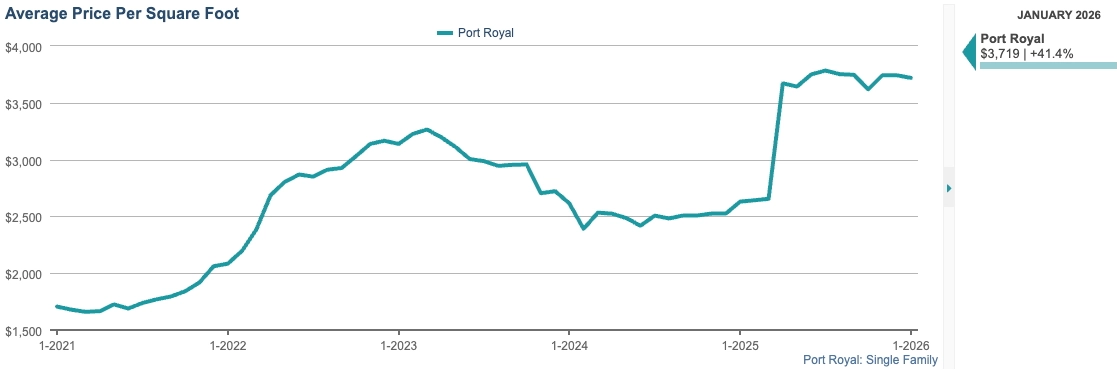
After dipping to around $2,500 in 2024, Port Royal's price per square foot has surged to near its all-time high — the 2024 softness was an aberration, not a trend.
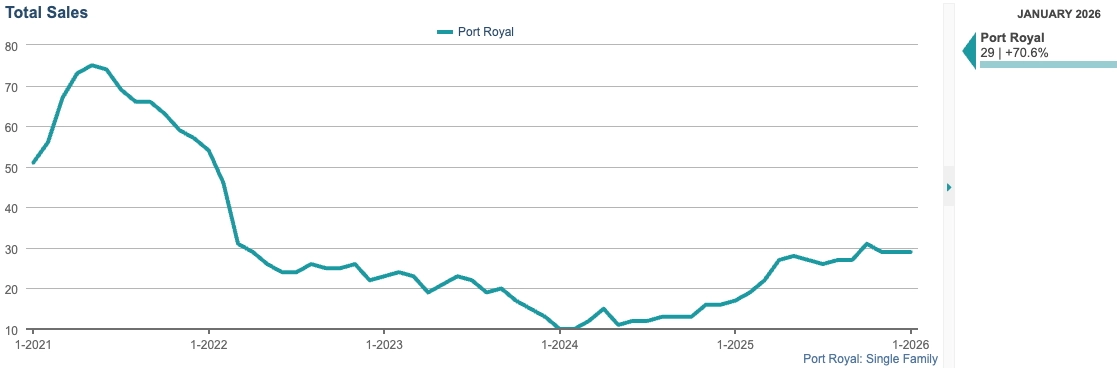
Transaction volume fell from 70+ at the 2021 peak to a low of 10–12 in 2024. The recovery to 29 reflects buyers returning with conviction, not just prices rising on limited volume.
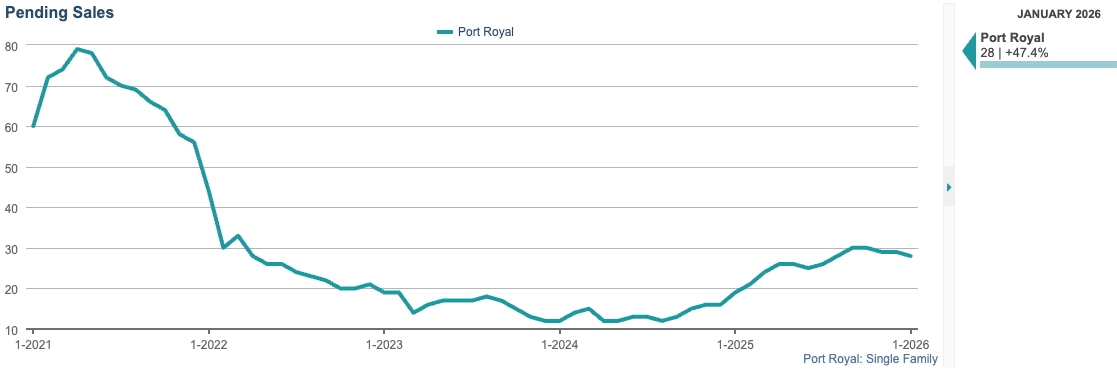
At 28, pending sales are approaching the 2022 recovery level and well above the 10–15 floor of 2023–24. The demand signal to watch heading into spring.
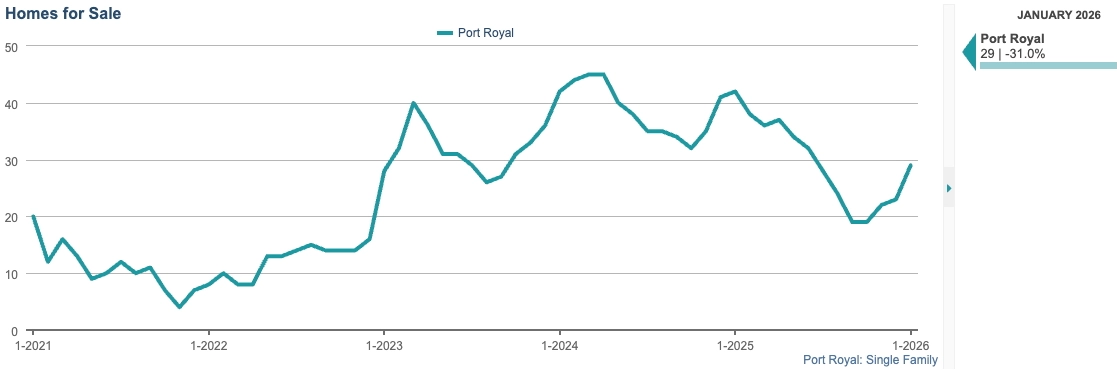
Inventory peaked at roughly 44 homes in mid-2024 and has contracted sharply. At 29 available homes, Port Royal is offering buyers the most limited selection since 2022.
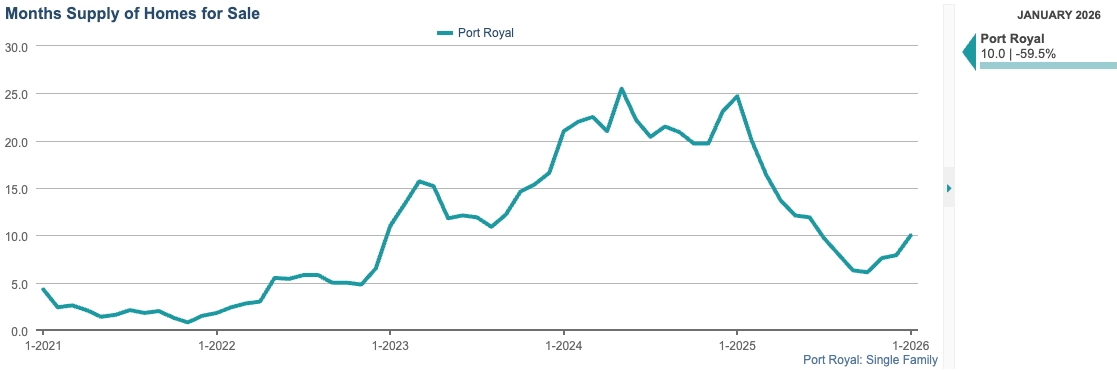
Months supply hit a high of 25.7 in late 2024. The near-60% contraction is one of the sharpest inventory corrections in any Naples segment this cycle.
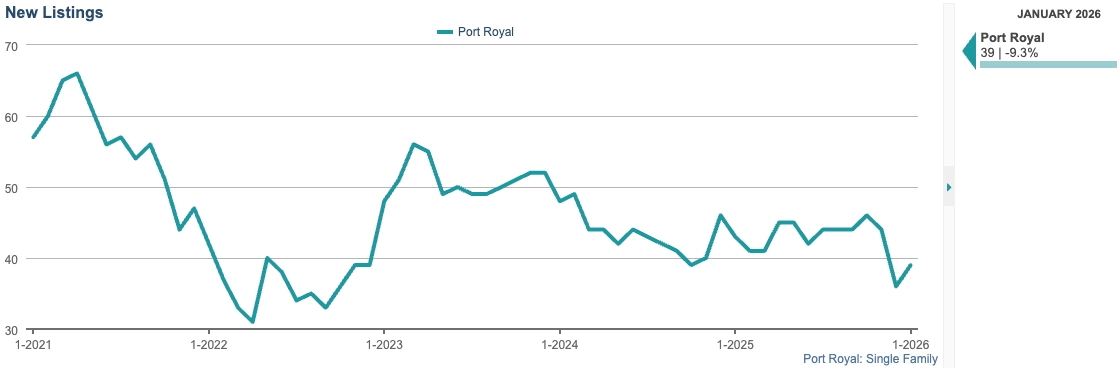
New listing volume has declined from a peak of ~68 in 2021. Rising demand against constrained supply — the imbalance is likely to persist through the 2026 selling season.
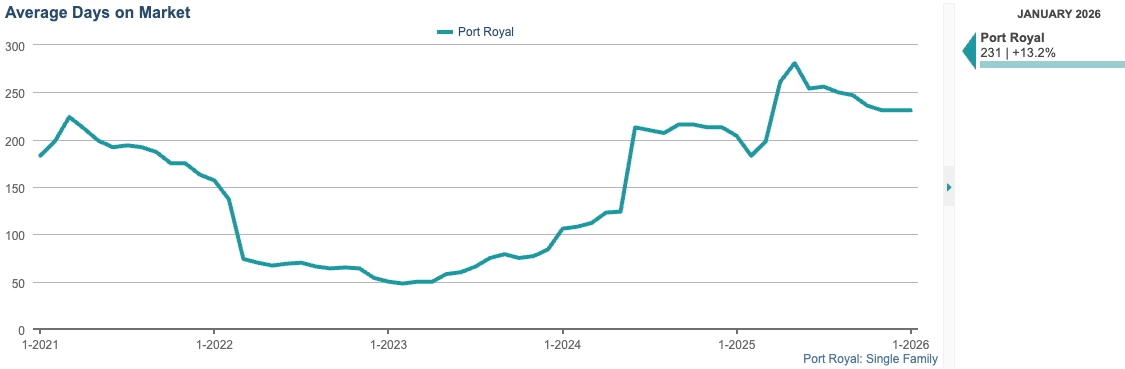
Reflects the reality of $15M–$50M+ transactions requiring extended due diligence and negotiation timelines. Stable in the 220–280 day range since 2024.
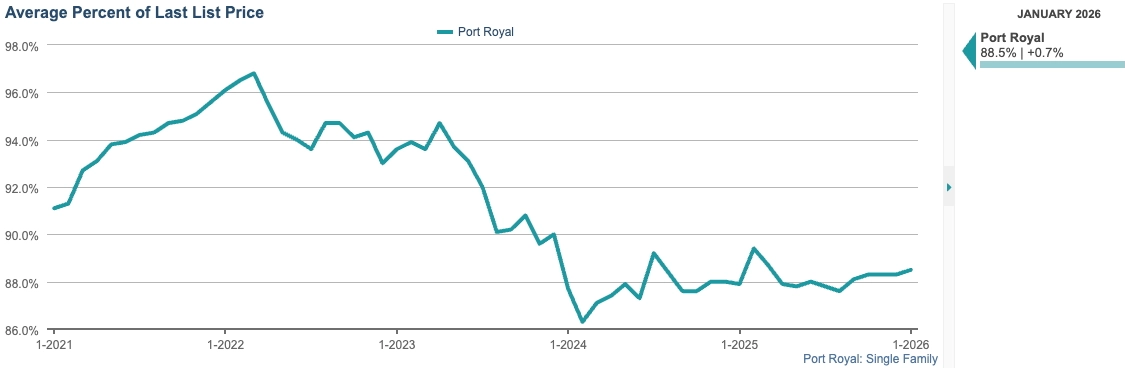
Sellers receiving 88.5% of last list price — stable and slightly improving. Plateaued at 88–89% since 2024, signaling a normalized negotiating environment at the ultra-luxury tier.
Port Royal is having a defining moment. Here is the full picture.
The relisting of Gordon Pointe at $271M has reset the conversation about what is possible at the top of the Naples market. Our Port Royal Club analysis covers the landmark rebuild reshaping the private club experience at the heart of this community — essential context for any buyer or owner.
What is the area real estate news for February 2026?
This month's local and regional news is dominated by Port Royal's record-setting activity, new luxury development breaking ground in Naples, and broader South Florida data confirming Naples' position as the dominant cash-buyer market in the nation.
Gordon Pointe relisted at $271M — redefining ultra-luxury in Naples
The Port Royal mega-estate has been relisted, resetting price ceilings in the Naples luxury market and drawing global attention to a neighborhood already operating at a different altitude from the rest of Southwest Florida.
Read the full story →paid in cash
luxury home sales
Golf Digest ranking
The Avenue Luxury Development Commences Construction
Naples' newest luxury mixed-use development has broken ground — expected to reshape a key corridor and add significantly to the city's high-end portfolio.
A Glance at Naples' Carnelian Hotel Plans
Detailed plans published for Naples' ambitious new luxury hospitality and residential concept — a potential defining address for the city.
Elevation Naples: Elevating Living Standards
A new luxury residential project debuts in Naples with a focus on elevated design standards and quality of living.
Port Royal's Housing Market Redefined by Gordon Pointe
A deeper analysis of how the Gordon Pointe listing is reshaping Port Royal's price tier and what it signals for the broader Naples luxury market.
Forbes: What's Going On in Naples?
Forbes examines the forces driving Naples' real estate market — national media attention now firmly focused on what has been unfolding here.
CAVU Golf Club Goes Fully Private in Naples
CAVU transitions to a fully private membership structure — a meaningful signal of deepening demand for exclusive golf access in Naples.
Calusa Pines, Naples — #20 in Golf Digest's 50 Greatest Courses Built Since 2000
Golf Digest places Naples on the world golf map, reinforcing the city's standing as a premier destination for golf-community buyers.
Bonita-Estero Rail Trail Corridor Agreement Unveiled
A multi-use trail connecting Bonita Springs and Estero — quality-of-life infrastructure strengthening the broader Southwest Florida region's appeal.
Down Payments Dip, Cash Buyers Retreat in Shifting Market
National data shows shifting buyer behavior — a useful counterpoint to Naples, where cash purchases rose to 67% of total sales in January 2026.
South Florida Luxury Homes at 4-Year High
Luxury home sales across South Florida have reached their highest level in four years. Naples sits at the premium end of this regional surge.
South Florida and Jacksonville Lead Nation in All-Cash Home Purchases
New data confirms South Florida markets lead the country in cash purchases — directly reflecting the buyer profile active in Naples.
Naples Area Housing Market Concludes Predictable 2025
A retrospective on Naples market performance through end of 2025 — essential context for understanding where 2026 is heading.
Naples Housing Market Data
Current market statistics and trends for the Naples, FL housing market — third-party data reference for buyers and sellers tracking conditions.
Looking for the full 2025 Naples market recap?
Our January 2026 newsletter included an extensive 2025 Year-in-Review analysis — covering the full arc of the Naples market across all price segments, inventory trends, and what the data signals for 2026. If you are making real estate decisions this year, that analysis provides critical baseline context.
2025 Year-in-Review →
Where can I find the full NABOR® and William Raveis market reports?
We publish detailed Naples area market reports each month drawing on both NABOR® and William Raveis data. The January 2026 reports are now available:
NABOR® January 2026 Naples Real Estate Market Report
Full NABOR® data analysis — all price segments, inventory
trends, and year-over-year comparisons for the Naples area market.
William Raveis January 2026 Naples Luxury Market Report
William Raveis luxury segment analysis — single-family and
condo data for the Naples area, including community-level snapshots.
Explore Matt Brown's Naples luxury real estate resources
Whether you are researching Port Royal, evaluating waterfront communities, or comparing Naples neighborhoods for a future purchase, the resources below are built on the same market intelligence this newsletter is built on.
William Raveis Real Estate
Experience
The January data and Port Royal momentum have you thinking — let's talk.
Matt Brown, ranked #922 nationally and #13 in Naples (2024) by RealTrends Verified and in the top 1.5% of agents nationwide (2025), with $700M+ in career sales across every major Naples luxury community, including direct experience in Port Royal, Old Naples, Pelican Bay, Grey Oaks, and the Naples waterfront, offers buyers and sellers the market intelligence this newsletter is built on. A single conversation covers more ground than weeks of online research.


The number that really caught my attention this month is the 40.3% jump in pending sales. That is not just a typical seasonal uptick. It shows buyers stepping off the sidelines and moving forward with confidence earlier in the year than we usually see in Naples.
The luxury single-family picture is encouraging. In the $1.5M–$5M tier, closed sales rose 2.9% and median price held at $2,350,000 year-over-year. That tells me we are seeing stability, not softness. At the $5M+ tier, closed sales increased 10.8% and median price for single-family homes climbed to $8.16M, up 8.8%. That is meaningful movement at a price point where transactions are purely discretionary.
The William Raveis data adds important context for the Port Royal to Bonita Beach Road corridor. On the single family side, closed sales jumped 35% year over year to 412 homes, while new listings fell 12% and available inventory declined 22%. That is a fundamentally tighter market than 12 months ago. The condo side tells a more balanced story. Closed sales were down 20% and median price declined, reflecting continued absorption challenges in the luxury condo category. Buyers in this segment have real negotiating room today.
Port Royal tells its own story this month, and the charts below tell it better than any summary paragraph can. Dollar volume more than doubled to $696.3M. Average price climbed to $24M. Price per square foot hit $3,719, up 41.4%. At the same time, inventory has narrowed from a peak of around 44 homes in 2024 to just 29 today. For serious Port Royal buyers, the selection is becoming more limited. Explore current Port Royal listings