REAL ESTATE NEWSLETTER: FEBRUARY 2024
Recent Real Estate News
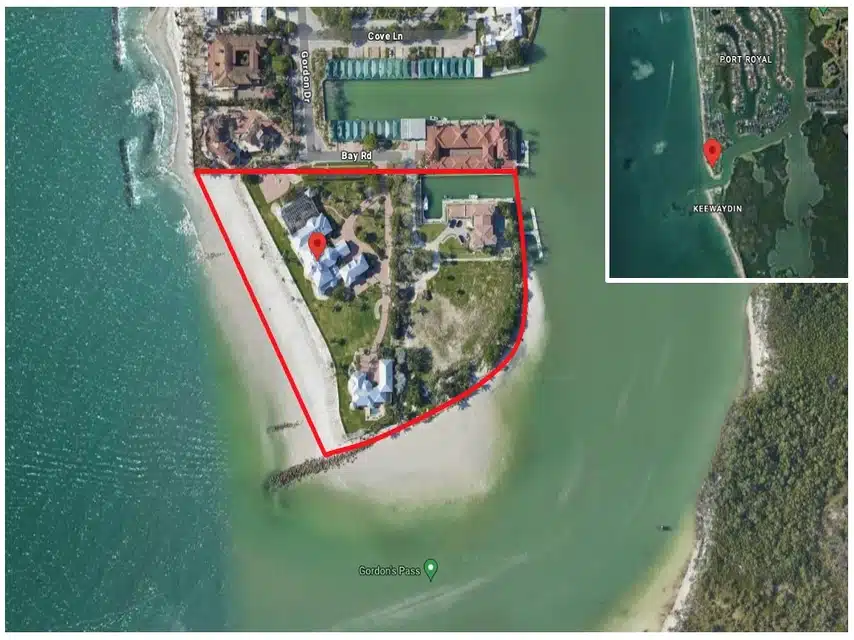
Naples real estate made the national news this month, did you see the headlines? Wall Street Journal, CNBC, Architectural Digest, and many other sources were all over the story: America’s Most Expensive Home for Sale Hits the Market for $295 Million (to be clear, it’s actually 3 houses and 9 acres of land for $295 million).
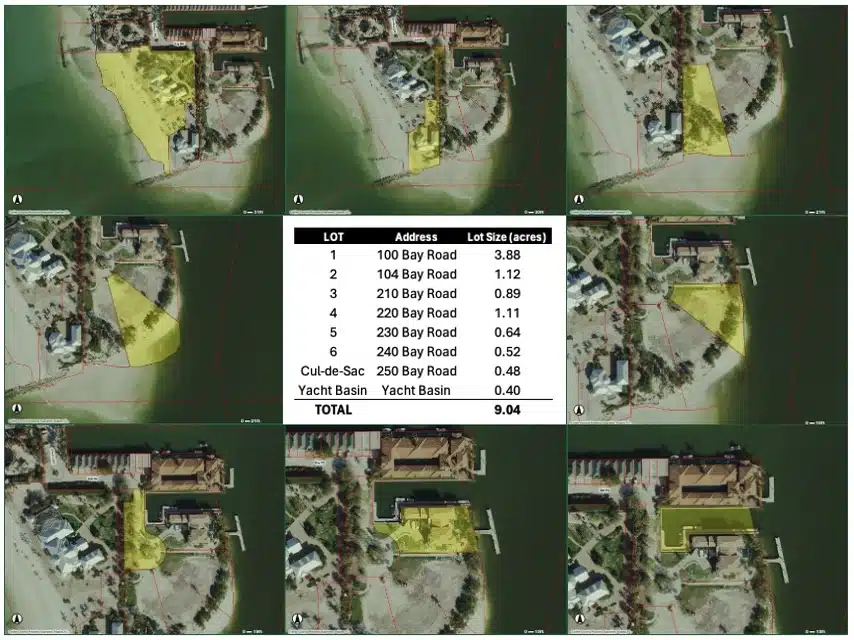
- Address: 100 Bay Road, Naples (Gordon Pointe is the southern most tip of land in Naples overlooking Gordon Pass and the Gulf of America)
- 9.04 acres and 22,800 SqFt of total interior space (over 3 homes)
- Currently 6 buildable lots and 3 existing homes
- Main Beach Home: 11,561 SqFt, built in 1989
- Guest House: 5,545 SqFt, built in 1990
- Bay House: 5,861 SqFt, built in 2013
- Maximum development potential: 219,377 SqFt
- 1655 feet of water frontage (708 feet of beach frontage and 952 feet of bay frontage)
- Yacht basis is 231 feet with 180 foot concrete floating dock + 111 foot T-dock
- Port Royal Associate Membership eligibility
- Port Royal Club is currently being rebuilt, check out the clubhouse plan flipbook here.
If you want to delve deeper into the Gordon Pointe property, learn more in our exclusive coverage.
What are your thoughts? Think it will sell? Reach out and let me know…
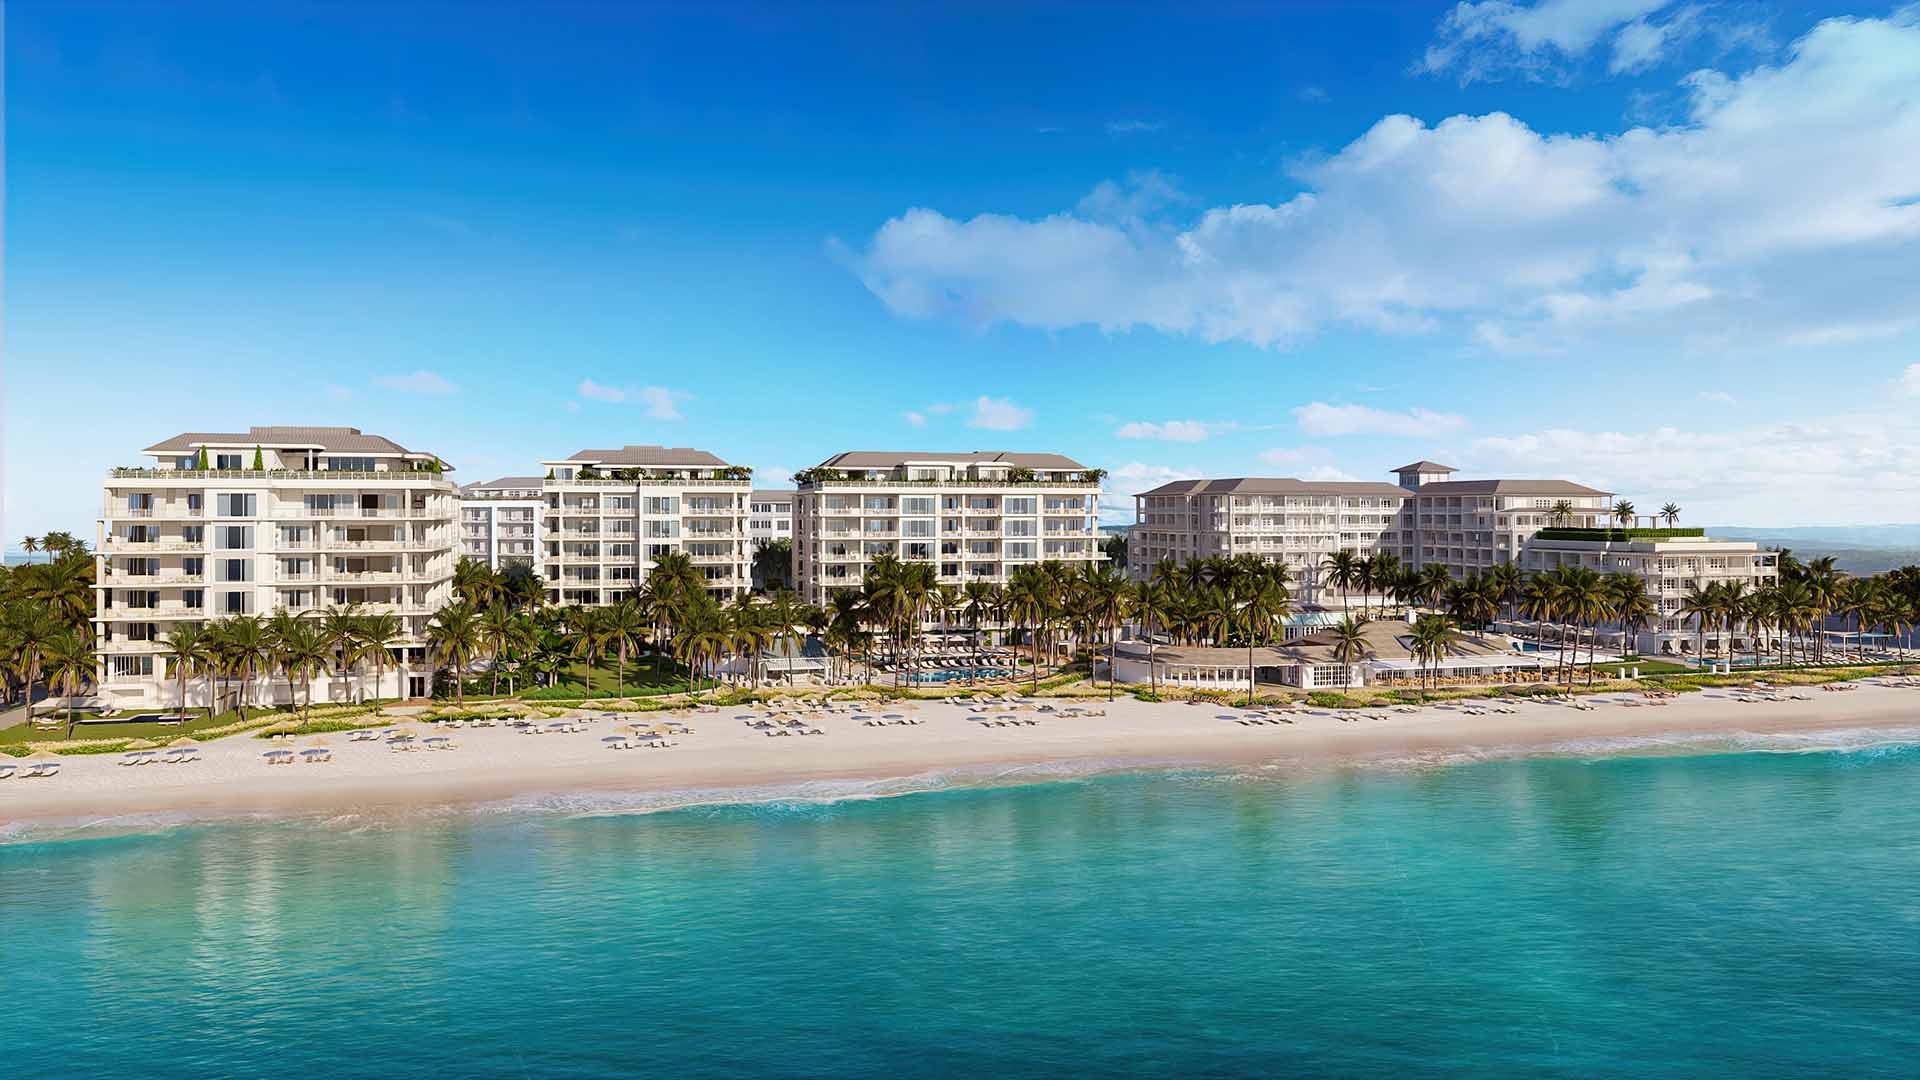
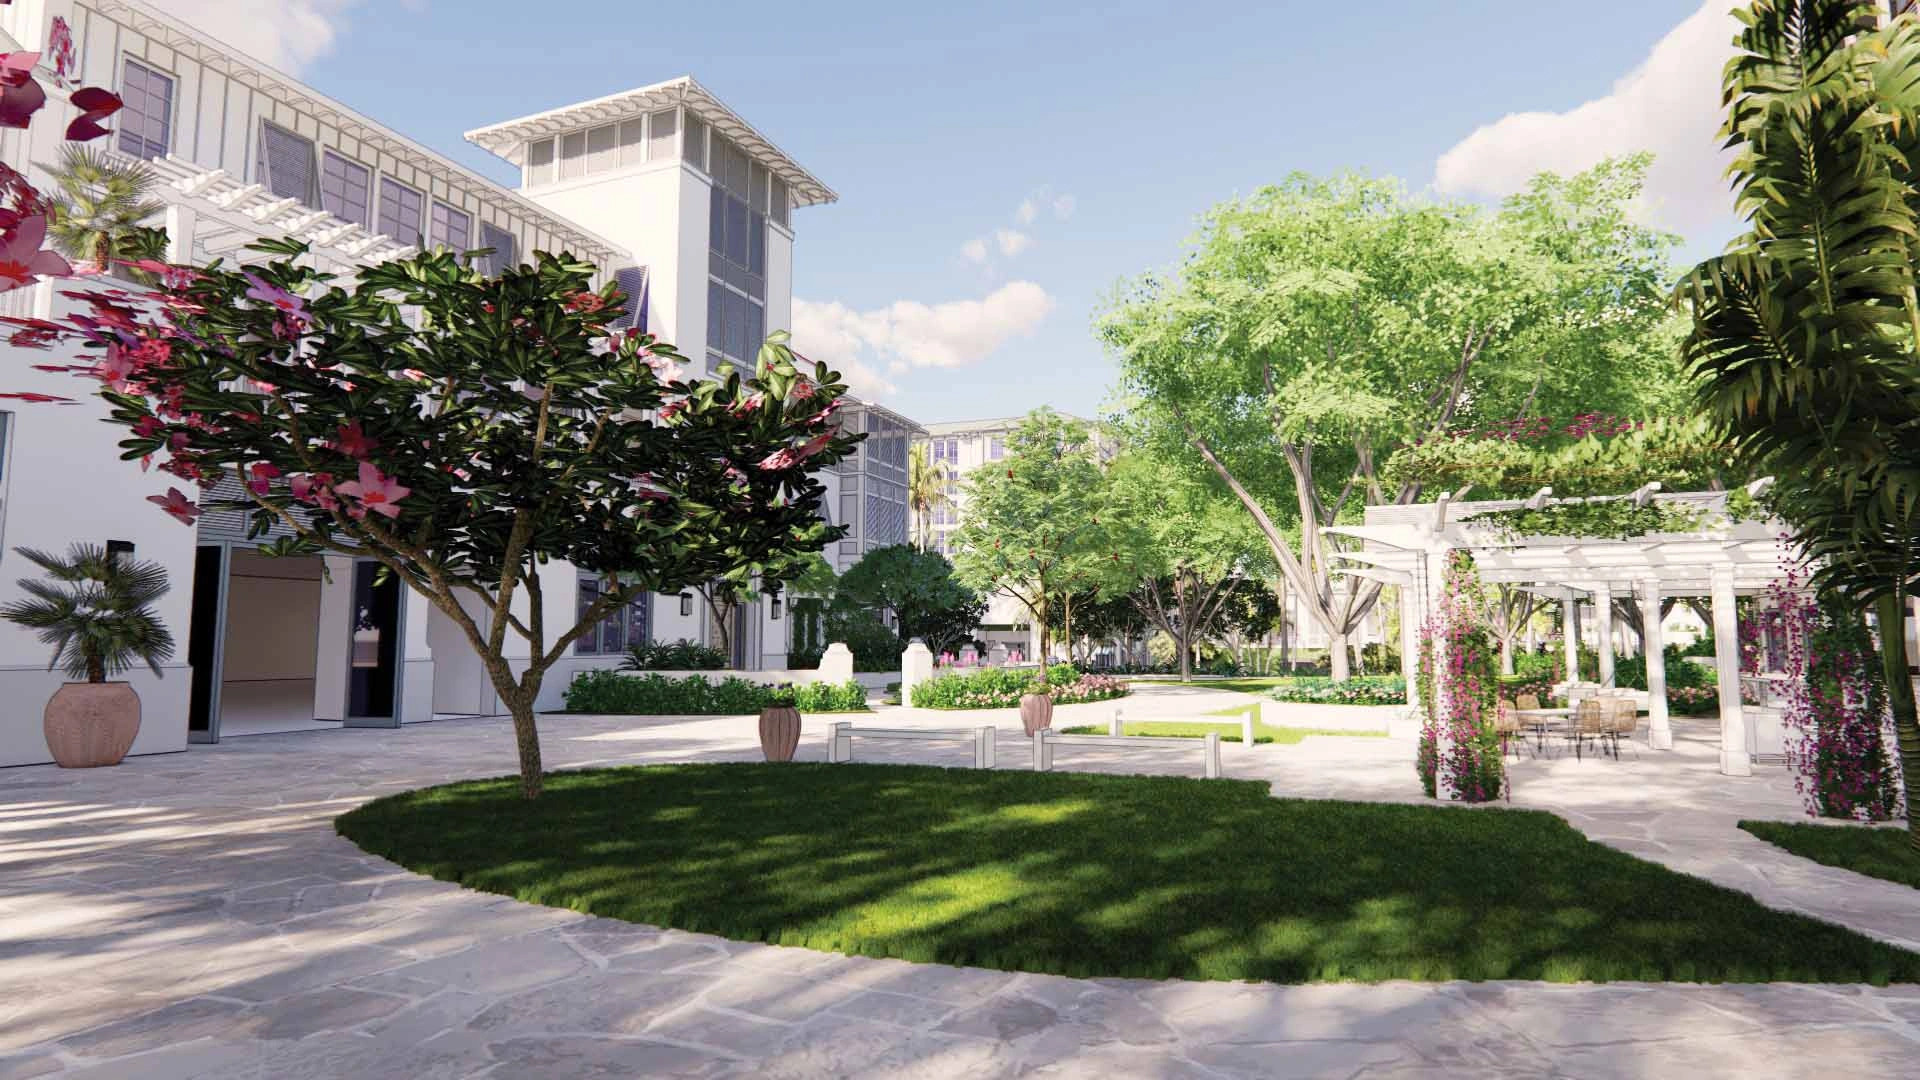
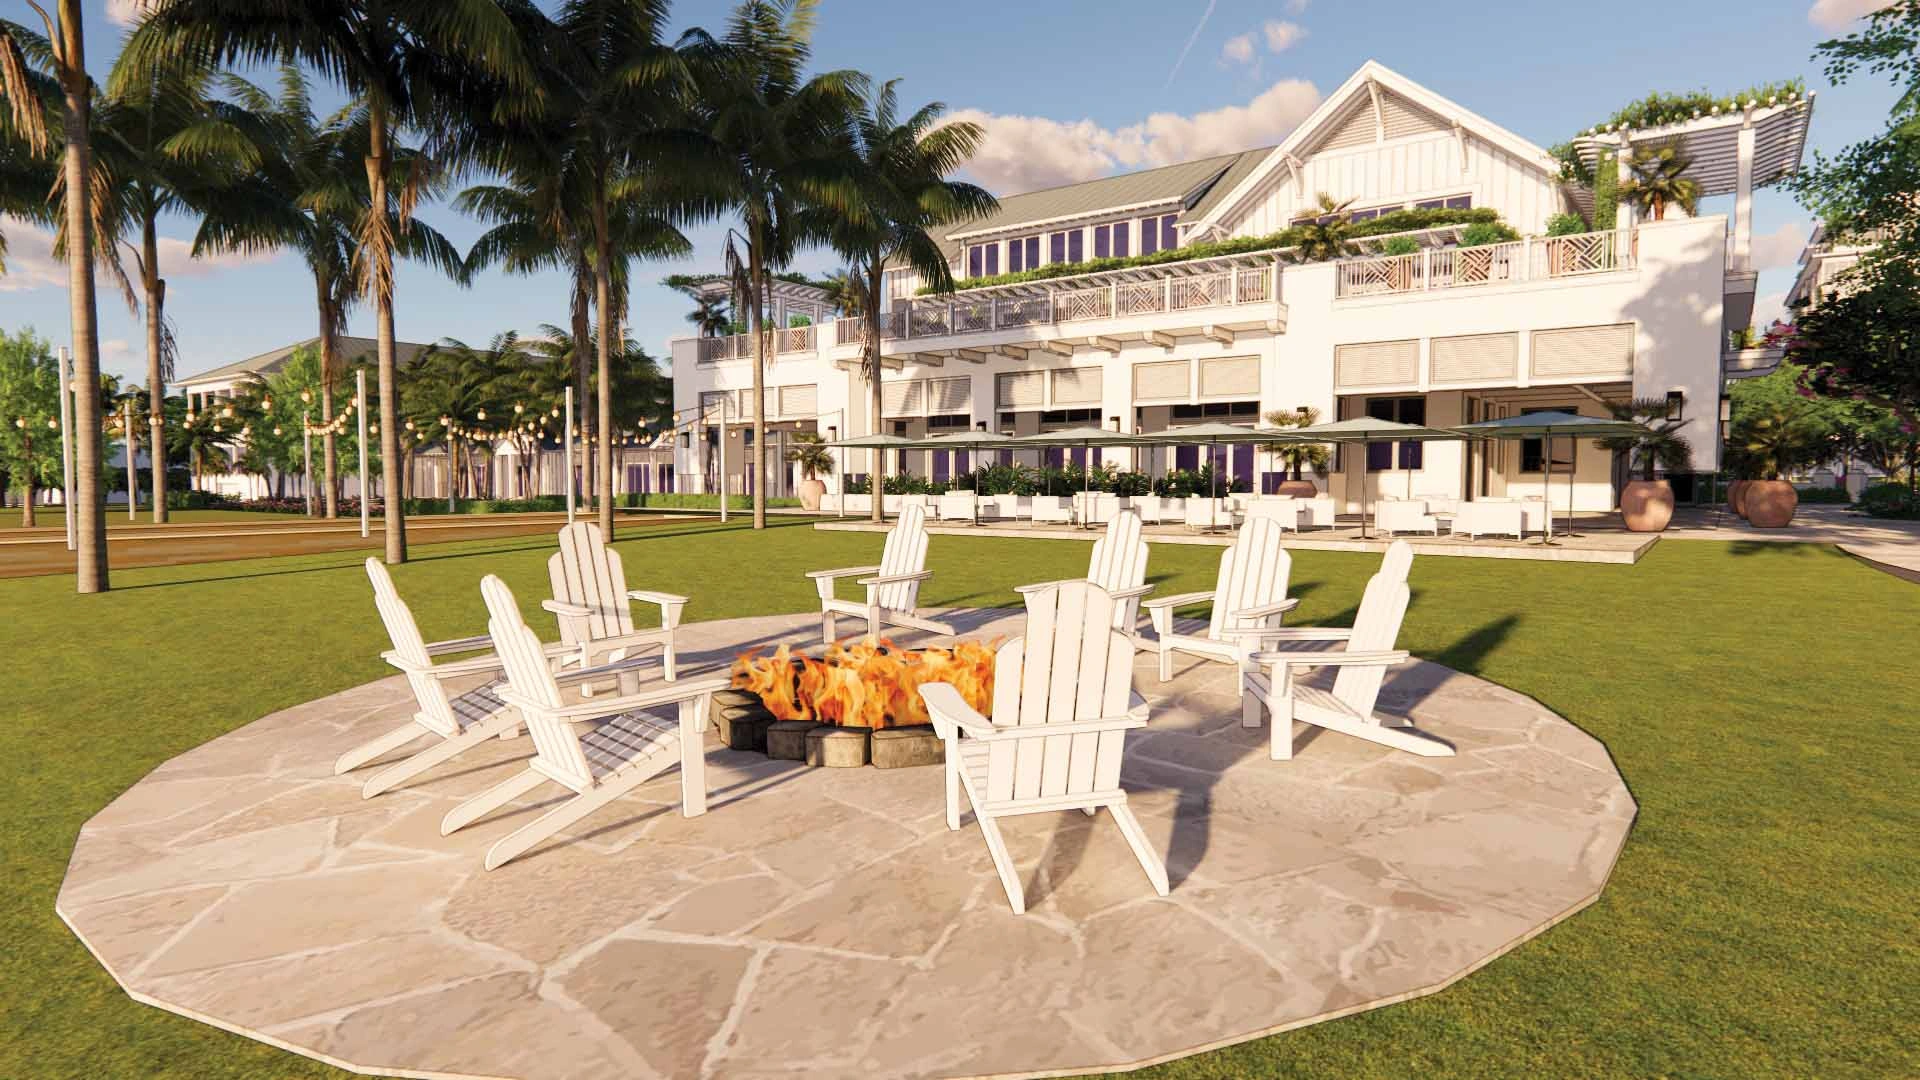
Naples Beach Club Update
The Naples Beach Hotel & Golf Club has been a Naples icon for decades and it’s redevelopment into a Four Seasons Resort and Residences is one of the most significant developments in Naples’ recent history. I just wanted to make sure you were aware of the latest details:
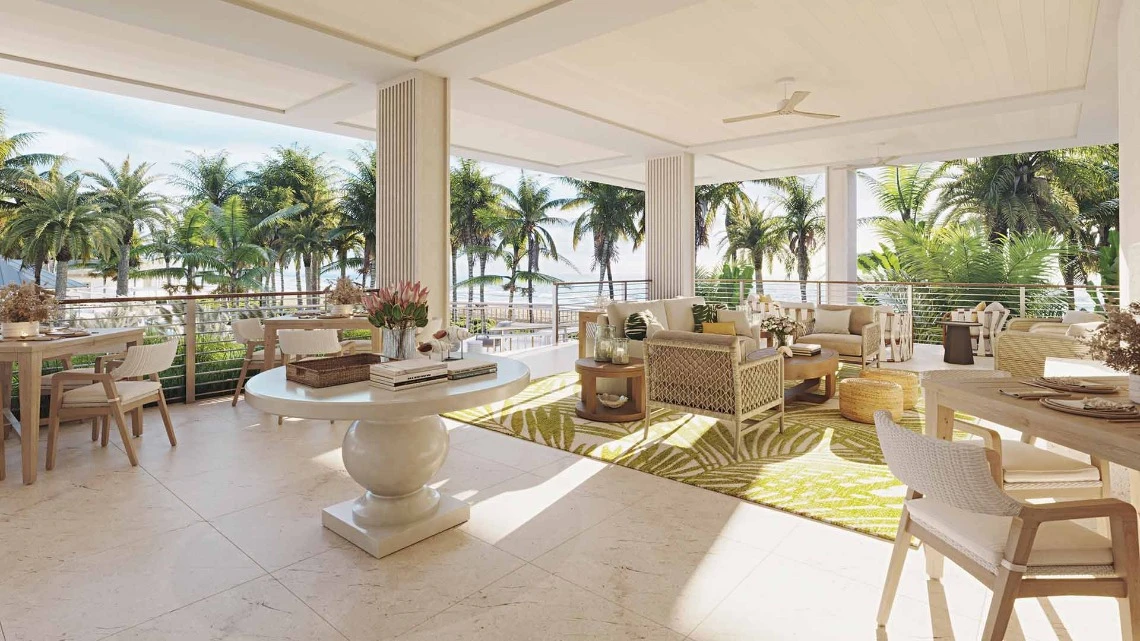
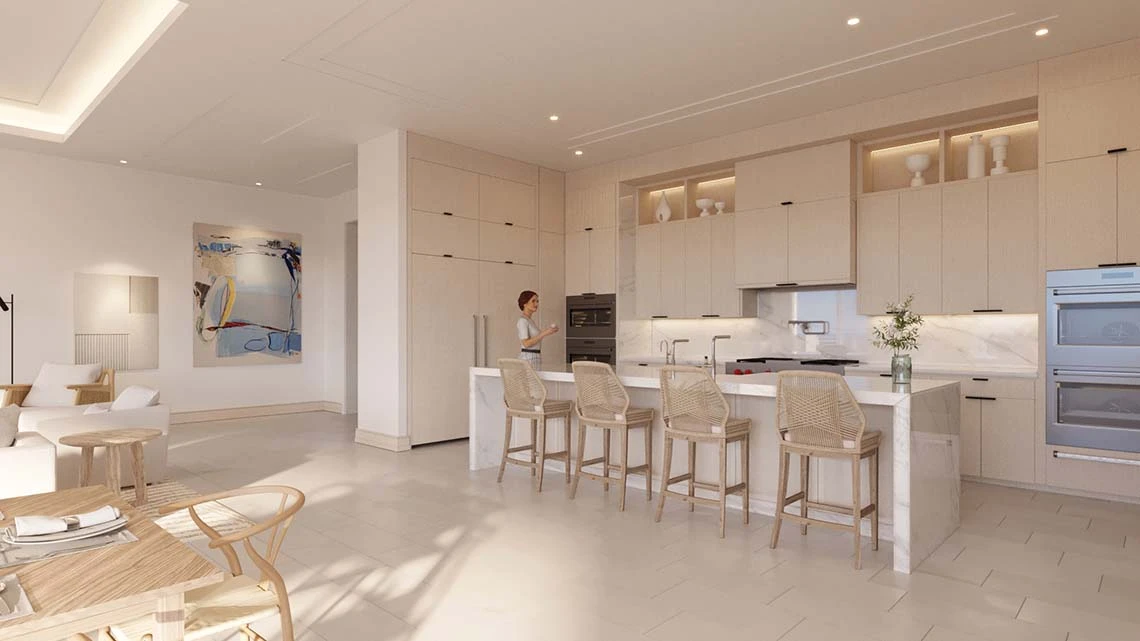
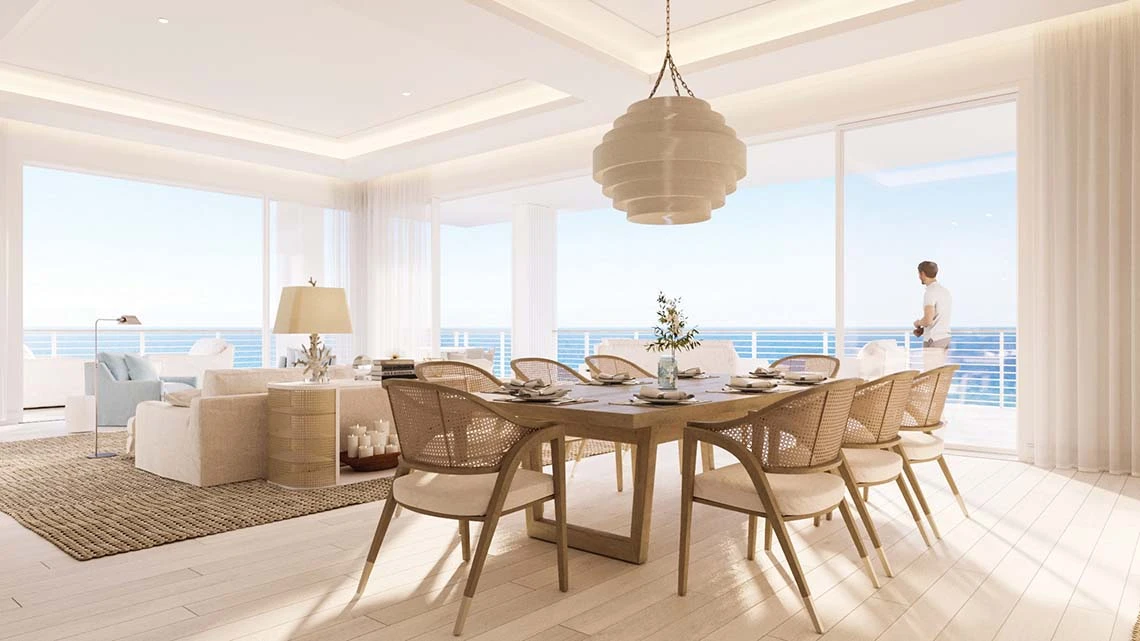
- The initial Naples Beach Club offering includes 58 luxurious beachside homes, including eight expansive penthouses and beach houses, scheduled for delivery in the 4th quarter of 2025. The Beachside Residences, penthouses, and beach houses showcase 12-14 foot ceilings, filling the interiors with natural light and coastal breezes. Spacious verandas provide a seamless indoor-outdoor living experience, offering captivating East and West-facing views for stunning sunrises and sunsets. With only 5 residences left, prices range from $24 million to $50 million.
- Phase II of the project, The Golfside Residences, are expected to be introduced in 2024 and made available for reservation/purchase. The Golfside Residences are anticipated to consist of 95 units across 5 buildings, ranging from 4 to 7 stories. Prices are estimated to start at approximately $6 million.
- The Four Seasons Resort is anticipated to open in January/February 2025, with the golf course ready for play in early 2026.
Please let me know if you have interest in the Naples Beach Club residences and check out this month’s featured blog post on the Naples Beach Club for additional details.
Enjoy this month’s newsletter! ~Matt
Naples Beach Club Images
Naples Real Estate Market Trends – January 2024 Market Trends and Commentary
In this month’s Naples real estate market trend review, I thought it would be interesting to break down the market by price segment to see how different sectors of the market are performing. I have included the entire Naples market over the last 5 years broken down into $0 to $2M, $2M to $5M, $5M to $10M and $10M+. The charts show all properties (single-family homes and condominiums) combined.
AVERAGE SALES PRICE (12-month rolling average)
The average sales price for a property in Naples over the last 12 months was relatively stable in each price segment. The average sale under $2M over the past 12 months was up 4.1% over the same period 1 year ago and the average sale over $10M was up 8.5% to $16,709,548. All segments combined the average sale over the last 12 months was $1,016,031, down 0.8% from the prior 12 month period.

AVERAGE PRICE PER SQFT (12-month rolling average)
The average sales price per square foot for a property in Naples over the last 12 months was relatively flat overall with an increase of 2.2% to $375/SF in the sub-$2M price range and a 5.5% increase to $2750/SF in the $10M+ range but decreased 1.6% to $995/SF for $2M to $5M, and decreased 5.3% to $1504/SF in the $5M to $10M range. All segments combined the average sale price per square foot over the last 12 months was $452 down 0.2% from the prior 12 month period.

MONTHS SUPPLY
This is one of the most important statistics regarding the current state of the real estate market since it combines the pace of sales with the number of properties currently available. The months of supply indicator measures how long it would take for all the properties on the market to be absorbed/sold if sales continued at the current pace and no additional listings came on the market. Generally 6 months of supply is considered to be a balanced market but within Naples luxury market, higher price points typically have a higher supply.
The supply of properties on the market in Naples has increased to 6.4 months overall which is considered a balanced market but at Naples’ highest price points above $10M, the supply has far outpaced demand with 50.3 months of supply, where 18-24 months was common prior to the pandemic. Supply in the $5M to $10M price segment doubled from the same time last year to 20.3 months but is still in the pre-pandemic “normal” range. It’s interesting to note that Naples saw a spike up to 39 months of inventory in late 2016 in the $5M to $10M price segment. In the $2M to $5M segment, supply of 10.8 months is still below the pre-pandemic “normal” range of 12 to 18 months. Below $2M, Naples has 5.6 months of inventory which is below the pre-pandemic “normal” range 6 to 9 months.

HOMES FOR SALE
At the end of JAN 2024, there were 4,697 properties on the market in Naples, up 61.1% from JAN 2022 but still well below the 5-year peak levels of 6569 properties seen in FEB 2019. Properties available below $2M are still well below the previous peaks but because overall property values have gone up roughly 2x since before the pandemic, there are a record high number of properties available within the other price segments. There are 631 properties for sale from $2M to $5M, up from 487 in JAN 2020. 242 properties are for sale from $5M to $10M, up from 119 in JAN 2020. 166 properties are for sale above $10M, up from 37 in JAN 2020.

NEW LISTINGS
There were 1,799 new listings introduced to the Naples market in JAN 2024, 30.7% more than the same month a year ago. New Listings typically peak in JAN so this spike in listing activity was expected. This overall number of new listings is still below the pre-pandemic annual peaks, for example in JAN 2019 there were 2,071 new listings.

PENDING SALES
There were 861 pending sales in Naples in JAN 2024, down 7.1% from JAN 2023. Pending sales typically hit their annual peak in March and we expect this year to follow suit. Interesting to note that the only price segment where pending sales increased compared to last JAN was in the $5M to $10M price range were activity was up 30% with 26 contracts.

TOTAL SALES
Total sales activity was down 14% in JAN 2024 compared to last JAN with 485 sales. Over the last 13 years JAN 2024 was the 2nd slowest month for closings in Naples since SEPT of 2017 when there were 436 sales and the only time in 13 years where sales dipped below 500 in a month.

TOTAL SALES CHART (12-month rolling total)
The 12 month rolling total sales count has flattened out and is trending slightly downward after cooling off from the surge in pandemic era sales activity from mid-2020 to late-2021. Sales over the last 12-months totaled 8,760 properties, below the 9,500-10,500 volume seen in 2019 and similar to the sales levels in late-2016.

DOLLAR VOLUME OF CLOSED SALES (6-month rolling average)
The total dollar volume of closed sales in Naples over the last 6 months was $3.5B, down 7.1% from JAN 2023 and the lowest total since JUN 2020. The total value of property sales over $10M in the last 6 months was $177M, well above pre-pandemic level in JAN 2020 of $91M but far below the pandemic fueled peak of $789M all-time peak in MAY 2022 which includes sales for DEC 2021 through MAY 2022.
")
AVERAGE DAYS ON MARKET (6-month rolling average)
Over the last 6 months, properties in Naples spent an average of 58 days on the market, a statistic that has been gradually increasing since the low point in JUN/JUL 2022 of 20 days but is still significantly lower than the average of 100 days on the market that were the norm for several years before the pandemic. The higher the price, the longer it takes to find a buyer. Properties under $2M take an average of 56 days and those over $10M are averaging 105 days on the market.

AVERAGE PERCENT OF LAST SALES PRICE (6-month rolling average)
Over the last 6 months in Naples, the average amount of negotiation from the last list price was 3.9% 2023. The higher the price, the more negotiating with sub $2M properties averaging 3.8% of wiggle room and those over $10M closing at an average of 6.5% below last asking. These indicators are similar to the pre-pandemic “normal” range of negotiation in Naples which was overall typically 4.5% negotiation from the last asking price.

Southwest Florida & Naples Real Estate Market Reports
Each month our real estate newsletter includes previous months’ published market reports for the Naples Florida area, which includes the William Raveis luxury real estate market report and the Naples Board of Realtors (NABOR) market report.
Featured Listings
Below are my current listings in the Naples area, please contact me if you are interested in seeing any of them.
Search Current Inventory
Below are new properties in Naples and Bonita Springs priced from $2M to $15M, all built after 2015.


